# Observability Beyond Monitoring: Understanding Your Systems Deeply
The dashboard shows everything green. No alerts are firing. Users are complaining about slow responses. Something is clearly wrong, but what?
This scenario reveals the limits of traditional monitoring. Observability offers something different.
## Defining Observability
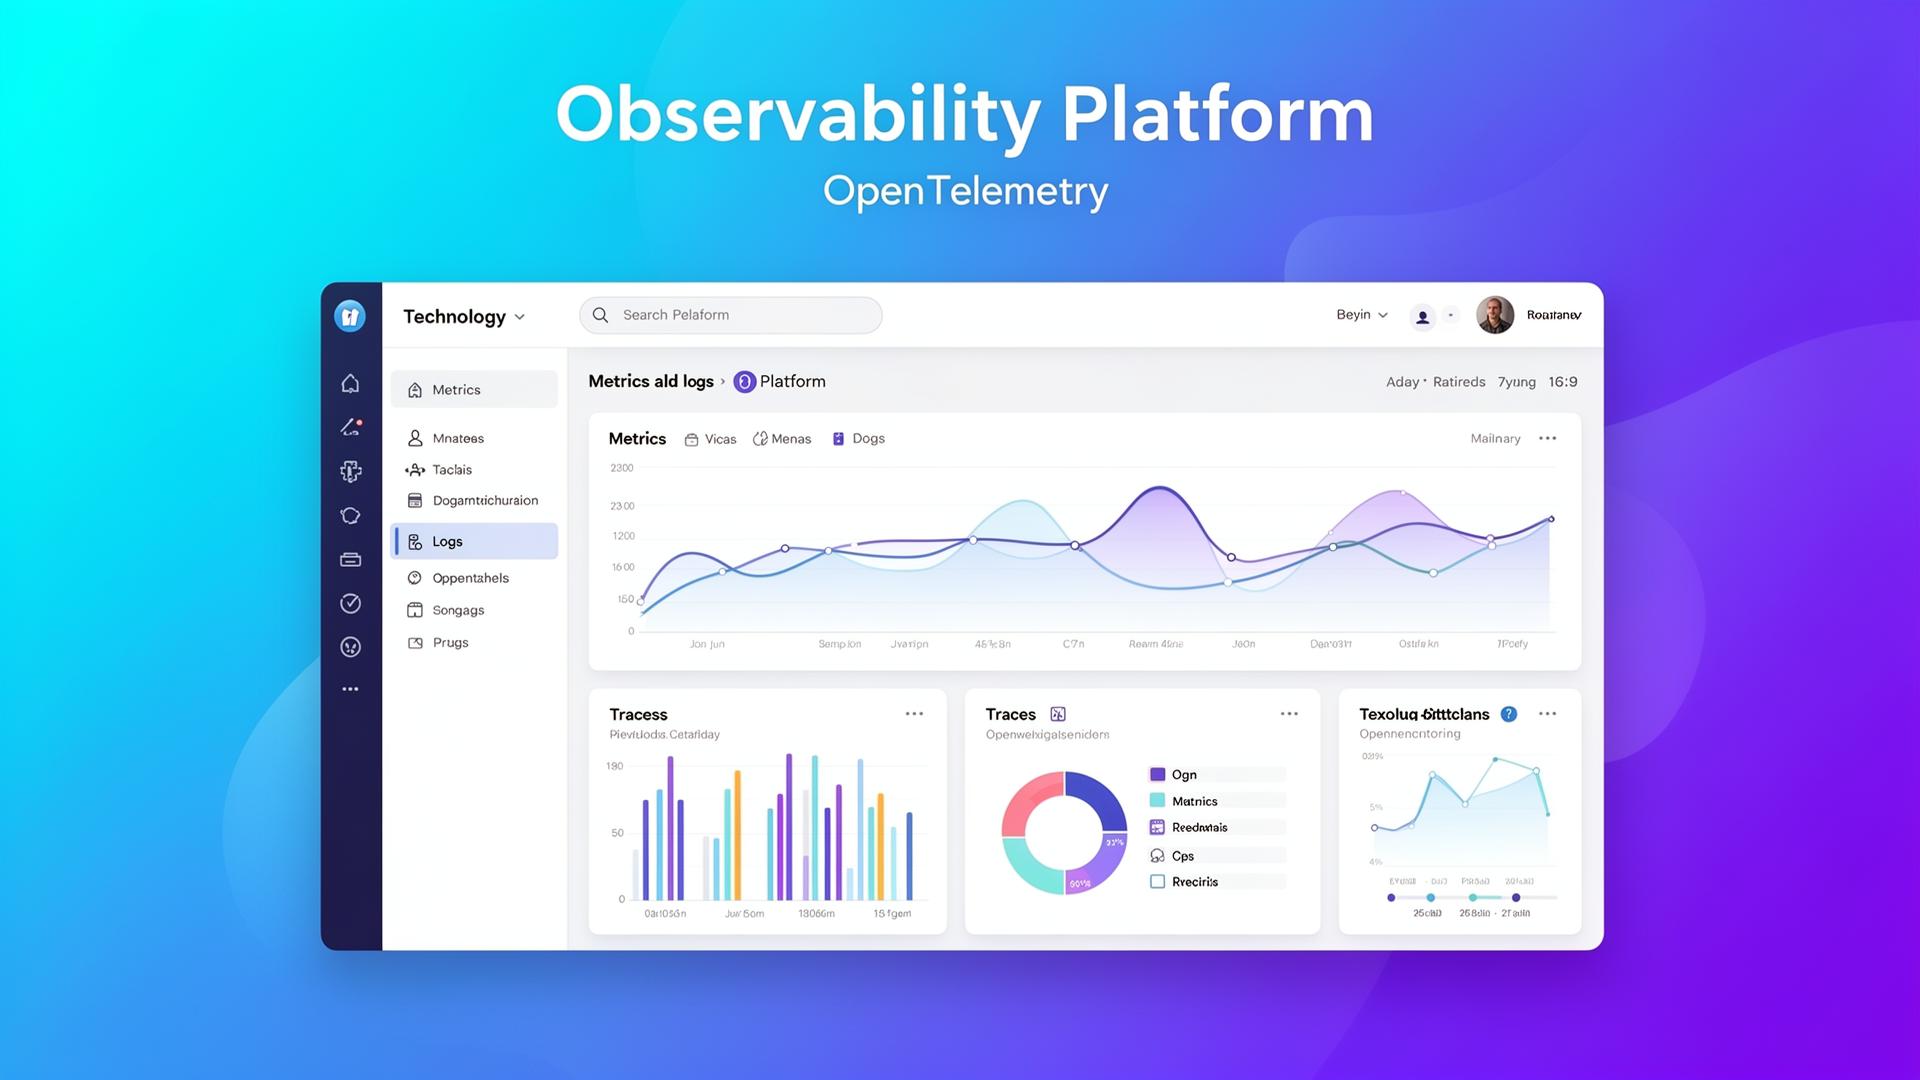
The three pillars of observability are **metrics, logs, and traces**.
**Metrics** show aggregate measurements over time. Request rates, error percentages, response latencies.
**Logs** capture discrete events. Individual requests, error messages, application output.
**Traces** connect related events across distributed systems. A single user request might touch dozens of services.
## Beyond the Three Pillars
**Profiling** adds continuous performance detail. CPU profiles, memory allocation, and lock contention visibility.
**Real user monitoring** captures actual user experience.
**Business metrics** connect technical observability to business outcomes.
## OpenTelemetry and Standards
OpenTelemetry provides vendor-neutral instrumentation. A single standard for collecting metrics, logs, and traces.
**Auto-instrumentation** reduces adoption effort. Libraries automatically capture telemetry from common frameworks.
## Distributed Tracing in Practice
**Traces** shine in microservices architectures. When a single request touches many services, understanding the complete picture requires tracing.
**Spans** represent individual operations within traces. Span timing reveals where time is spent.
**Tail-based sampling** examines complete traces before sampling decisions.
If you want help implementing observability, contact us through our contact page.
## What to Instrument First
If you cannot instrument everything at once, prioritise what reduces mean time to resolve:
1. **Golden signals**: latency, traffic, errors, saturation. 2. **Critical user journeys**: login, checkout, key API calls. 3. **Dependency edges**: database, queue, third-party APIs.
## Logs, Metrics, Traces: Practical Division of Labour
- **Metrics** answer: “Is it bad right now?”
- **Logs** answer: “What happened?”
- **Traces** answer: “Where is the time going across services?”
The mistake is treating logs as observability. You need correlation (trace IDs) and consistent context (service name, environment, tenant/company).
## Making Alerts Actionable
An alert that cannot be acted on is noise. For each alert, define:
- an owner,
- a runbook link,
- a severity and expected response time,
- and a clear condition (avoid “CPU > 80%” without context).
## SLOs: The Missing Link
Service Level Objectives (SLOs) connect engineering to outcomes. Start with one SLO per critical service (for example 99.9% successful requests under 500ms) and use error budgets to drive prioritisation.
## What to Instrument First
If you cannot instrument everything at once, prioritise what reduces mean time to resolve:
1. **Golden signals**: latency, traffic, errors, saturation. 2. **Critical user journeys**: login, checkout, key API calls. 3. **Dependency edges**: database, queue, third-party APIs.
## Logs, Metrics, Traces: Practical Division of Labour
- **Metrics** answer: “Is it bad right now?”
- **Logs** answer: “What happened?”
- **Traces** answer: “Where is the time going across services?”
The mistake is treating logs as observability. You need correlation (trace IDs) and consistent context (service name, environment, tenant/company).
## Making Alerts Actionable
An alert that cannot be acted on is noise. For each alert, define:
- an owner,
- a runbook link,
- a severity and expected response time,
- and a clear condition (avoid “CPU > 80%” without context).
## SLOs: The Missing Link
Service Level Objectives (SLOs) connect engineering to outcomes. Start with one SLO per critical service (for example 99.9% successful requests under 500ms) and use error budgets to drive prioritisation.